Fishbowl Reports for Purchase Planning
See what, when, how much and from whom you need to buy!
Below are some examples of Fishbowl Reports for Purchase Planning.
Shortage Report

This report assists with Purchase Planning for Manufacturing. The report looks at open Work Orders, their Raw Goods, the Qty Needed, Total Qty, Part #, Description, Default Vendor, and Part Cost.
Inventory Usage Report
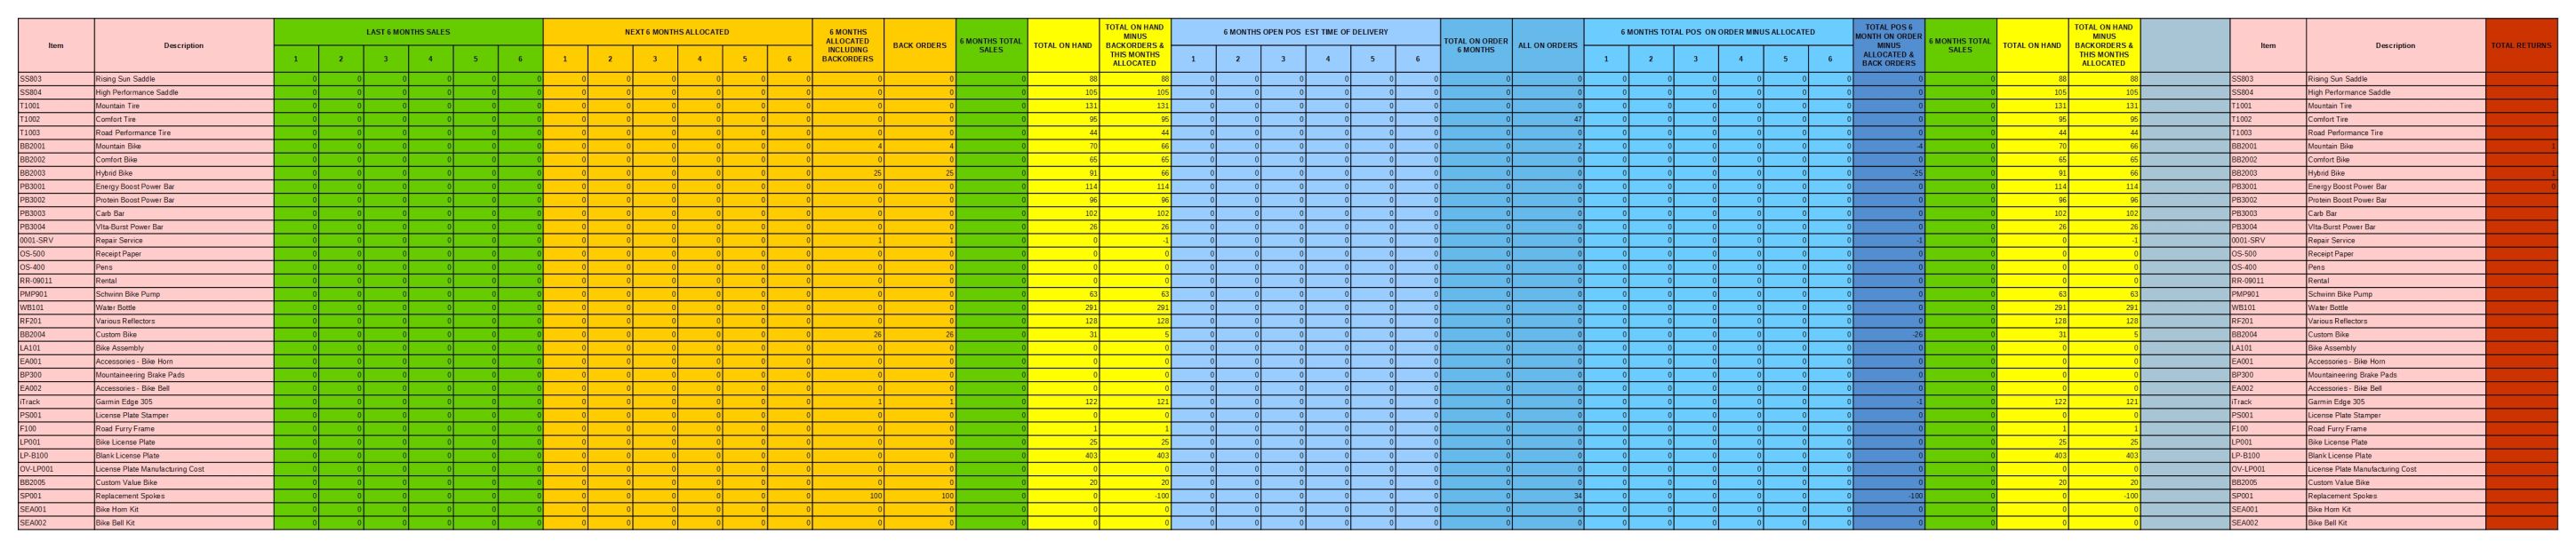
This is a Fishbowl Dashboard Report that looks at many of the metrics for the Part Number. It has the information for the Last 6 Months Sales, Next 6 Months Allocated, 6 Months Allocated Including Backorders, Back Orders, 6 Months Total Sales, Total On Hand, Open Purchase Orders and many other metrics, broken down by 6 months and summarized. The report allows the end user to perform Purchase Planning at a large scale, while accounting for many variables.
Purchase and Receiving Report

This report allows for analysis of Purchasing and Receiving. The report displays the PO Information, the Part being bought, the Purchase Order Date Issued, the Date Received, Supplier, Qty Ordered and Received, Unit of Measure, Cost per UOM, Total Landed Cost, as well as the PO Due Date.
Purchase Assistant Report

This Fishbowl report looks at Parts, displays their images, shows the default Vendor, the Vendor Part Number, On Hand Qty, Total on Open SOs, Total on POs, Reorder Point, Qty Sold in Date Range, Amount Sold in Date Range, Vendor Cost, and Average Cost.
Part Demand and Supply Report

This report breaks down Part Demand and Supply by Week for 4 weeks. It then shows the Short/Over information per week, allowing to plan purchases for the next 4 weeks.
Part Cost Over Time Report

This Fishbowl report analyses Part Cost over three Date Ranges. It then displays the Avg Cost, Qty, and $ Spent for each date range.
Interested in our services?
Connect with us to discuss your needs.