Inventory Analysis Reports
Fishbowl Inventory Analysis Reports help to analyze the dynamics of your inventory according to key performance indicators. Inventory turnover, aging, ABC classifications as well as potential margins are some of the most common KPIs.
You can also analyze your inventory costs in terms of direct and indirect costs, as well as the value and quantities of your different types of inventory.
Fishbowl Inventory Analysis Reports provide the following information about items in your inventory:
- Which items are in the greatest demand
- Differences in transaction costs versus current costs
- Profitability
- Value
- Turnover
- Supply and demand
- Tag information for each item
Part Quick Report

This report looks at one specific Part Number, shows where it is allocated, it’s quantity on hand, as well as the transactions where this Part Number is involved.
Merchandise Analysis by Item Number Report
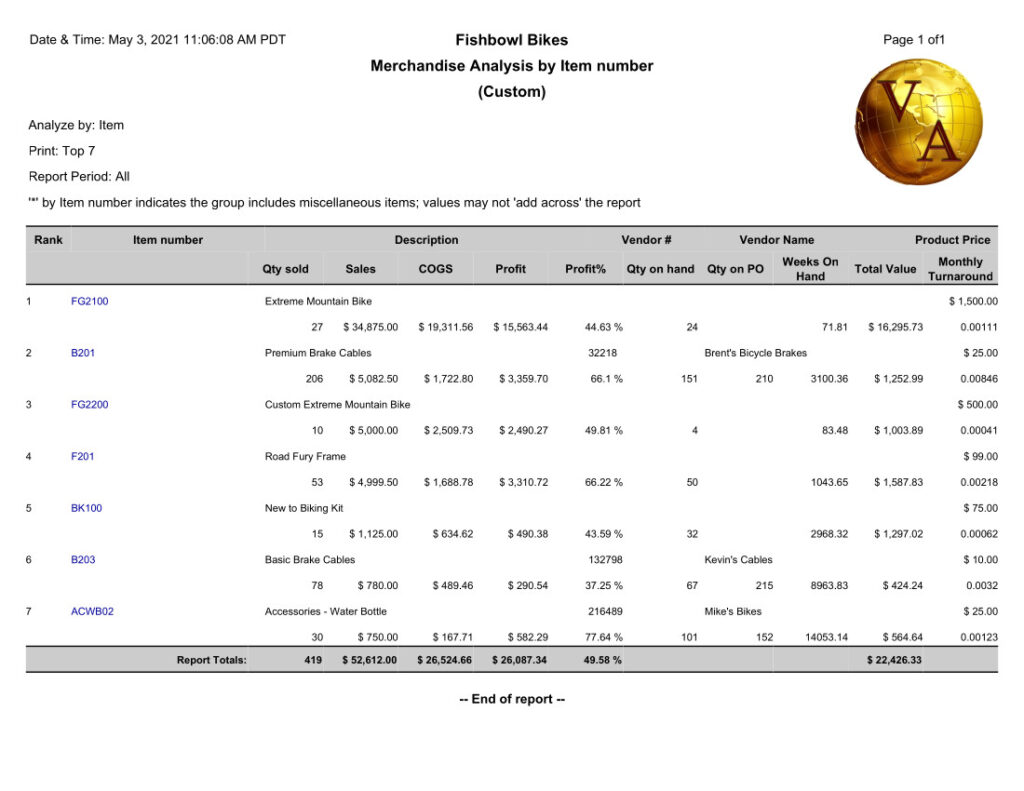
This is a Ranking report that ranks Products (Items) by their Total Sales within a date range. In this report, you can see the top-performing items, together with their Sales, COGS, Profit, Profit Numbers, Qty On Hand, Qty On PO, Total Item Value, and the Monthly Turnaround of the Item.
Product Planning Report
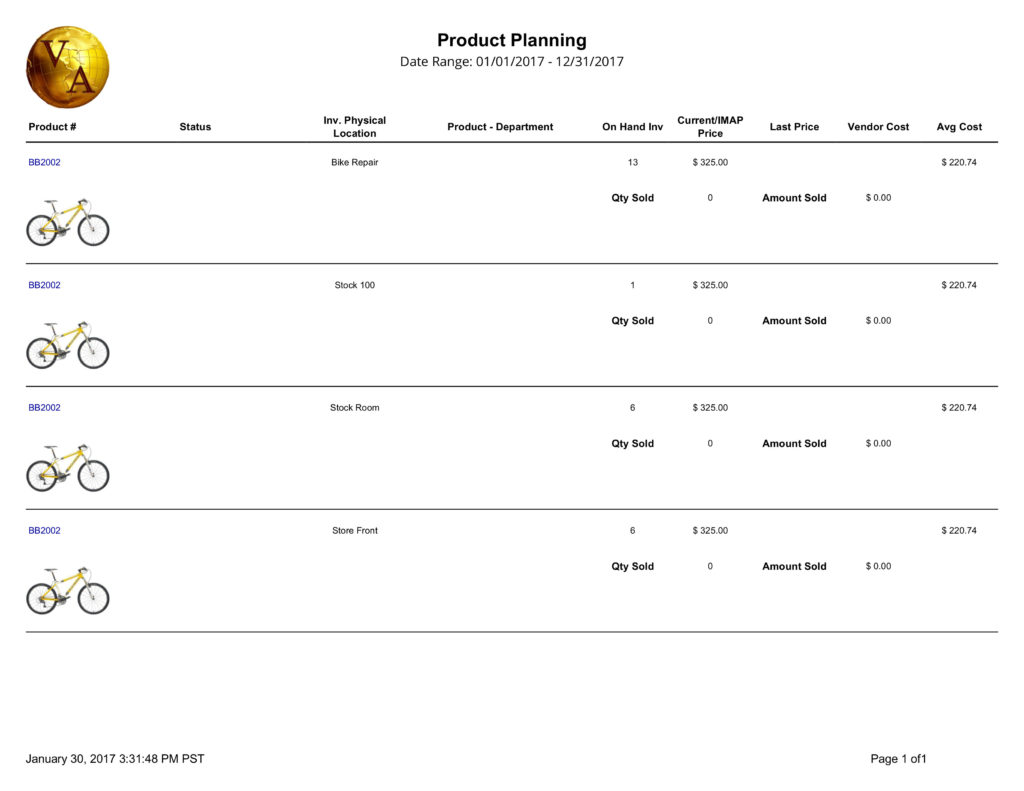
This report displays the Product Image, On Hand Information, Sales, as well as the Average Cost of a Part.
Product Inventory Pricing Report
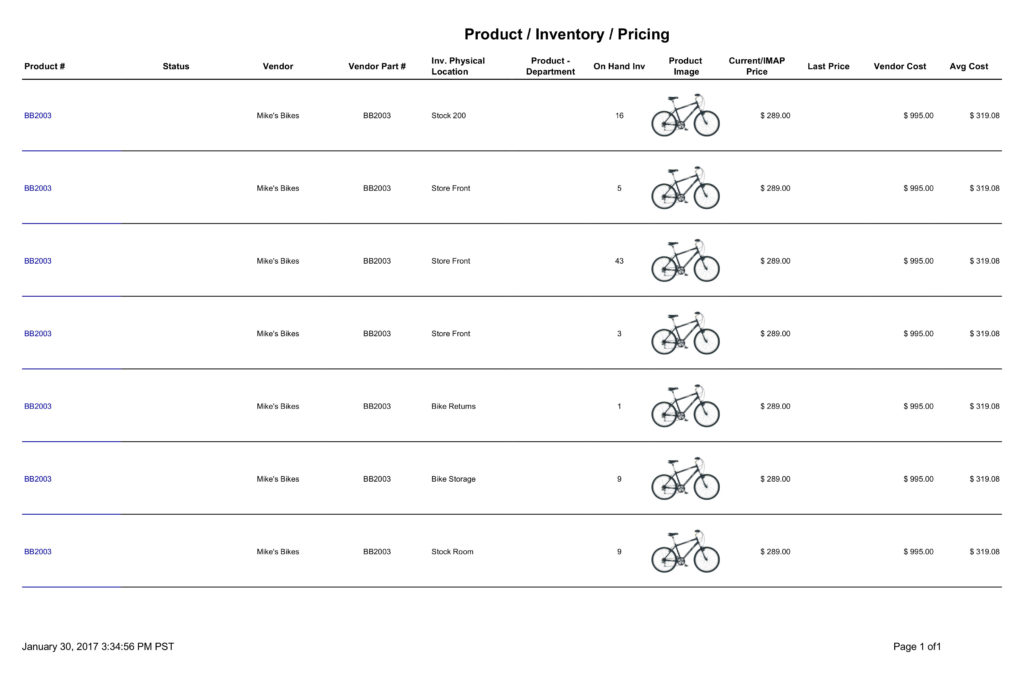
This report displays the Image of the Product, the default Vendor for the Product, the Price, the Vendor Cost, and the Average Cost.
Inventory Usage Report
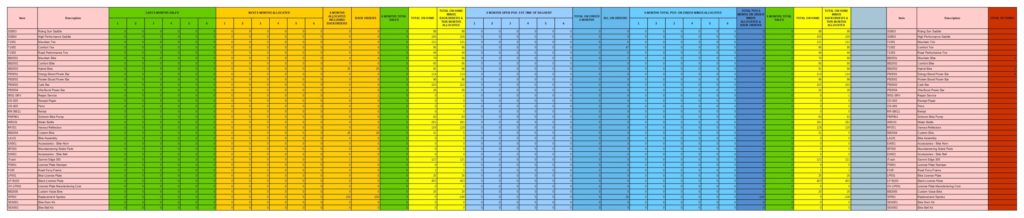
This is a Dashboard Report that looks at many of the metrics for the Part Number. It has the information for the Last 6 Months Sales, Next 6 Months Allocated, 6 Months Allocated Including Backorders, Back Orders, 6 Months Total Sales, Total On Hand, and many other metrics, broken down by 6 months and summarized.
Part Usage Report
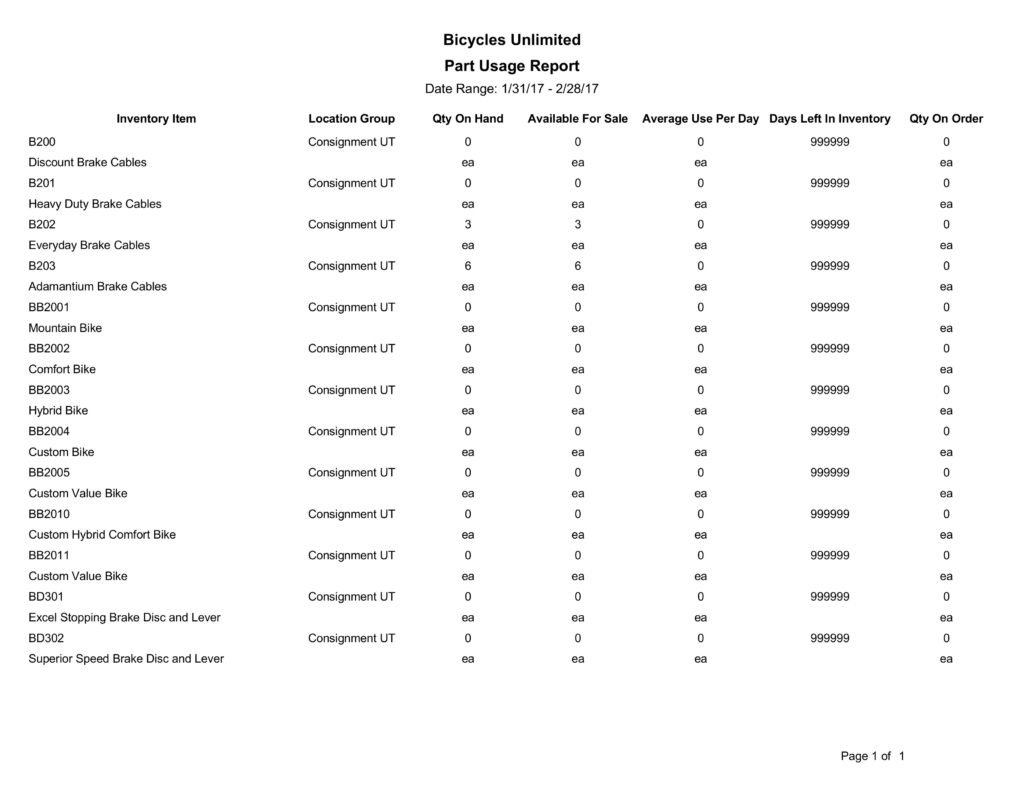
This report looks at all Part Numbers, their Qty on Hand, Qty Available for Sale, Average Use Per Day, Days Left in Inventory, and Qty On Order.
Fulfilled Inventory Usage Report

This report looks at Parts and their usage in Work Orders, Sales Orders, Transfer Orders, On Hand less Total Usages, On Hand vs Usage Dollars, and the Part On Hand Information by Location Group.
Open Picks by User Report

This is a Fishbowl report that’s used for analyzing the state of the Picks and their Inventory requirements. It displays open picks grouped by User with a red-green-yellow flag based on the pick status.
Open Picks by Date Report

This is a Fishbowl report that’s used for analyzing the state of the Picks and their Inventory requirements. It displays open picks grouped by Date Scheduled with a red-green-yellow flag based on the pick status.
Interested in our services?
Connect with us to discuss your needs.