Fishbowl Sales and Performance Reports
Fishbowl Sales and Performance Reports guide leadership’s decision-making and represent an important information management priority for many businesses. It also identifies management priorities and best practices.
As a company manager, you need to constantly monitor your team's performance in order to help you take accurate and relevant decisions for the company. Therefore, the Reporting section of Sales represents a very important tool that helps you get a better understanding of where your company's strengths, weaknesses, and opportunities are, showing you trends and forecasts for key metrics such as the number of opportunities and their expected revenue over time, the close rate by team or the length of the sales cycle for a given product or service.
Customer 2 Type Date Comparison Report
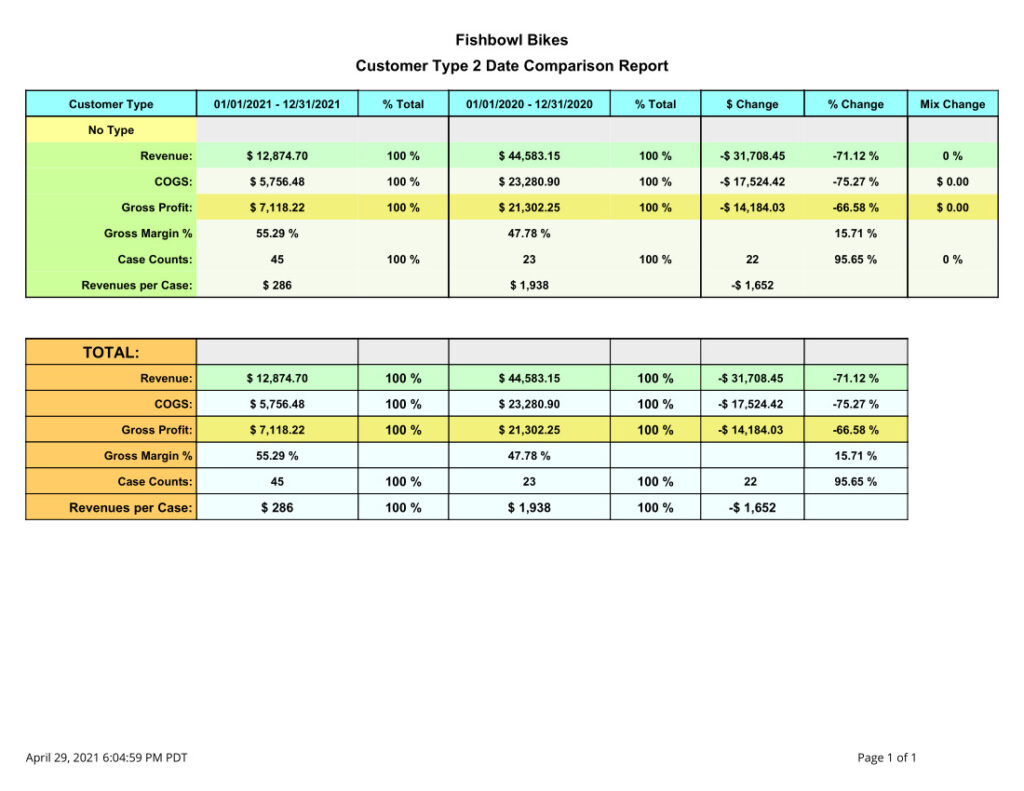
This report compares sales data by Customer Type, Revenue, COGS, Gross Profit, Gross Margin %, Case Count, and Revenue per Case. It then summarizes it and compares it between the two date ranges, allowing for analysis of performance both by Customer Type and by the main Income and COGS Accounts.
Quote Order Review Form
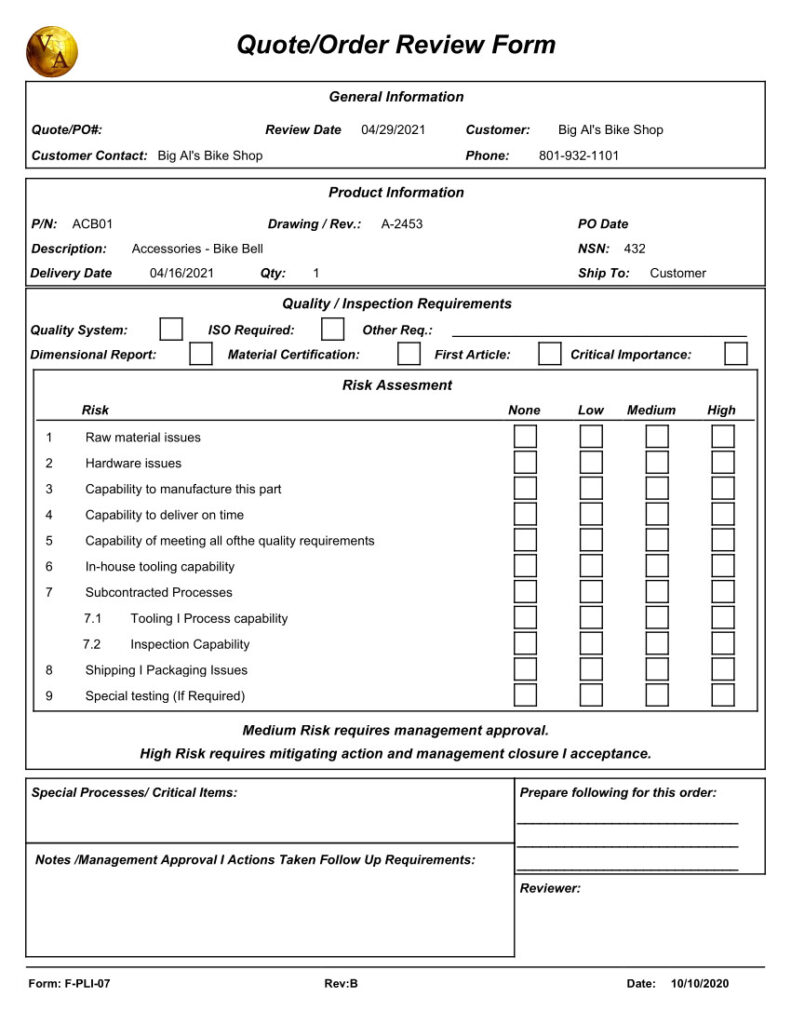
This is an Order Review form that allows to qualify Risk Assessments for a particular Order.
Gross Margin Report with Case Count
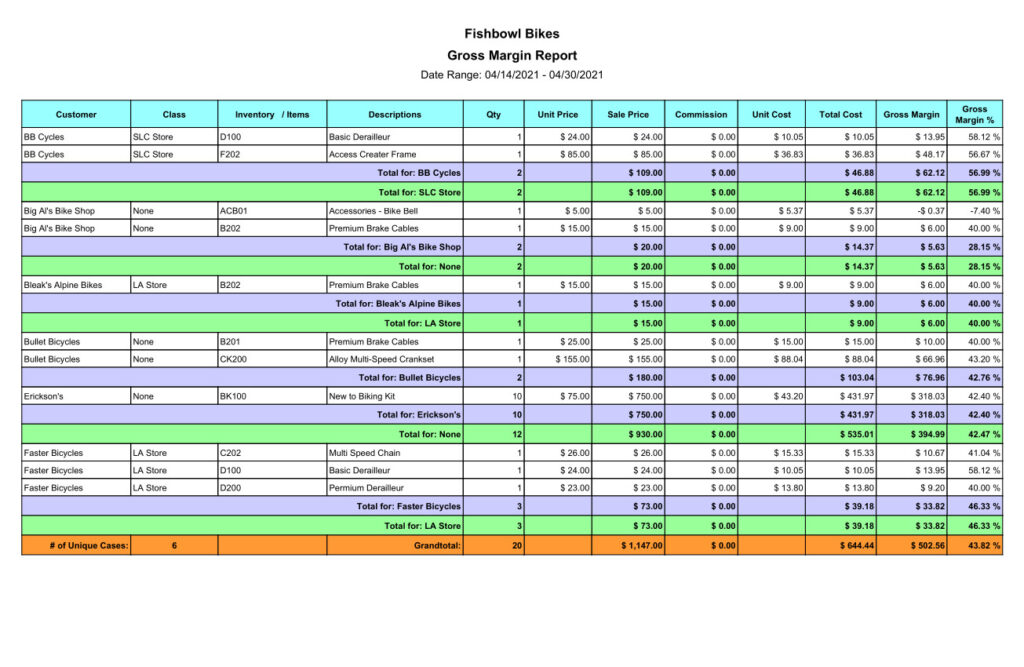
This is a Custom Margins Report that looks at Sales within a given Date Range, shows their commission amount (based on a custom field), calculates Margin and Margin %, and allows for analysis of the performance of Products within the specific customer.
Commissions Report
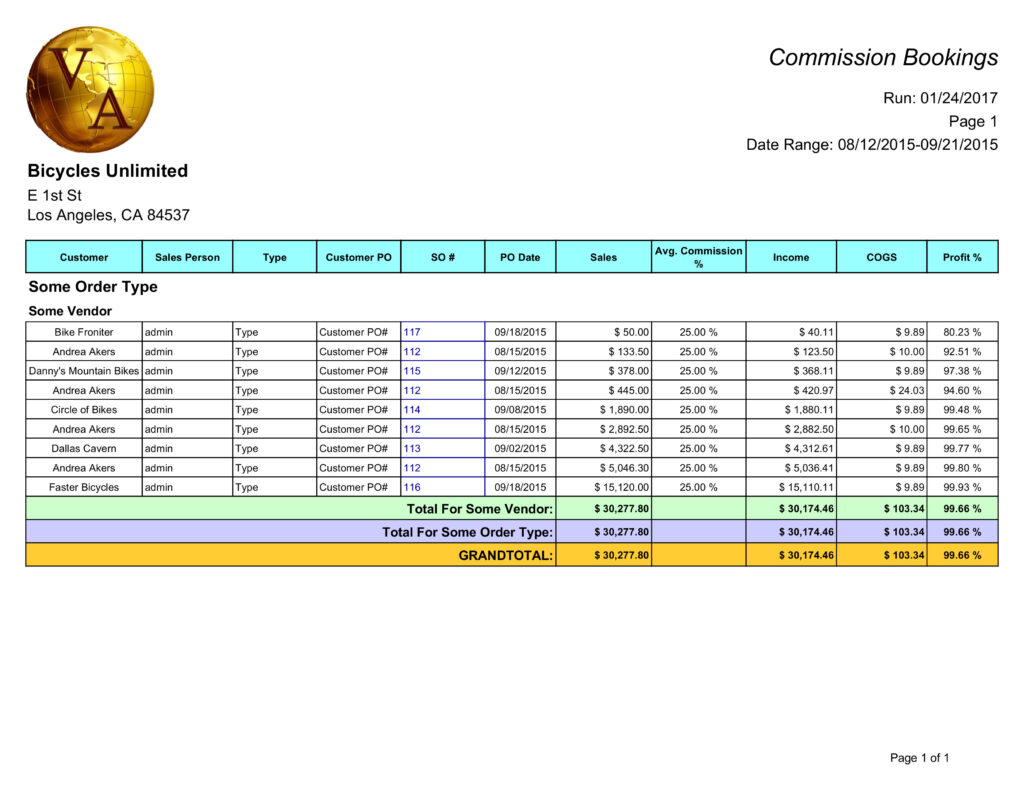
This is a report that breaks down Commission per Vendor, while also displaying their performance per Sales Order, measured in Gross Profit Margin Percentage.
Customer Summary Report
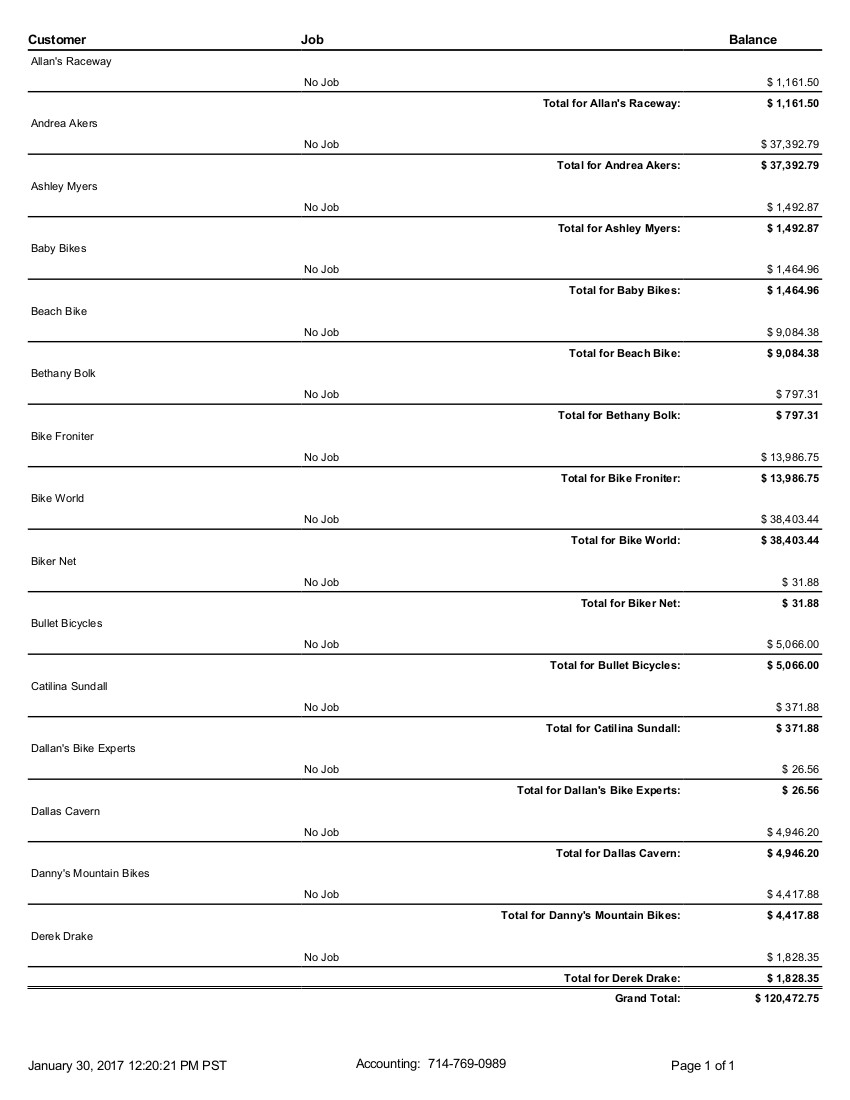
This report looks at Customers and their Jobs and calculates their Balances Due.
Customer Statement Report
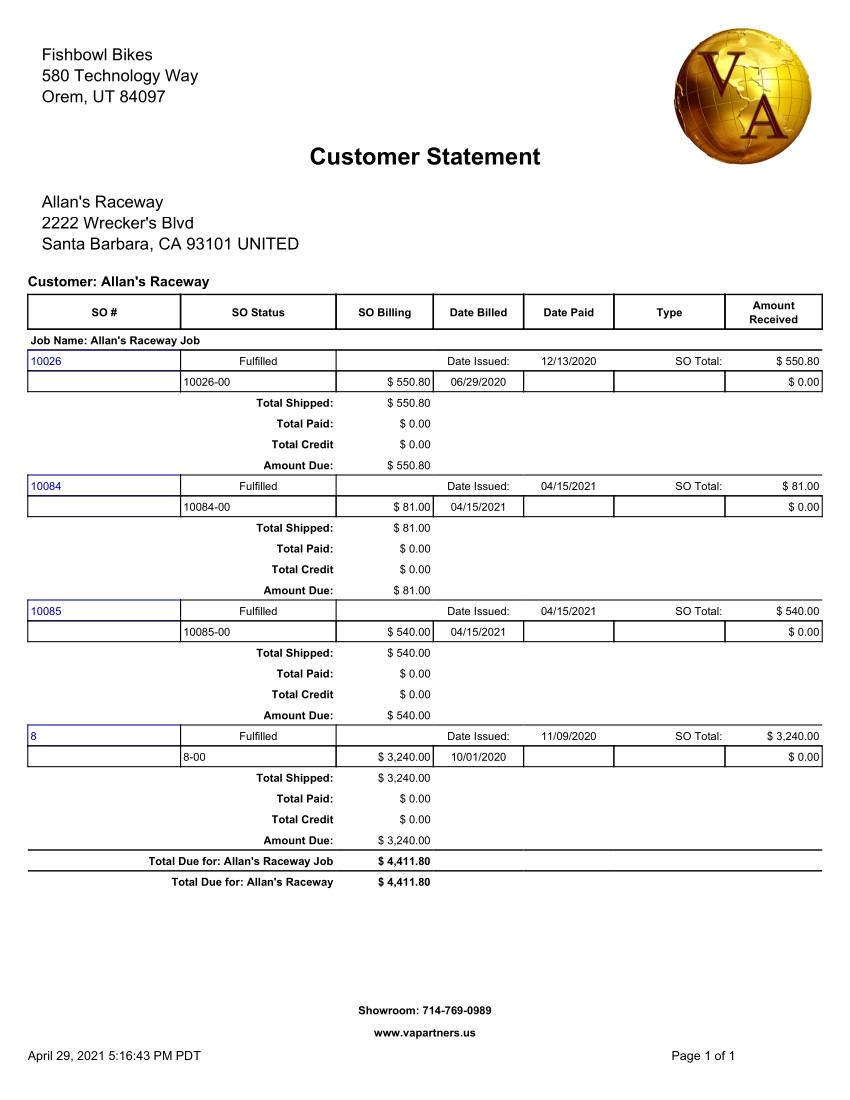
This report creates a Customer Statement in Fishbowl, based on Sales Orders, Payments, Shipments, and Credits.
Gross Margin Report For 2 Periods
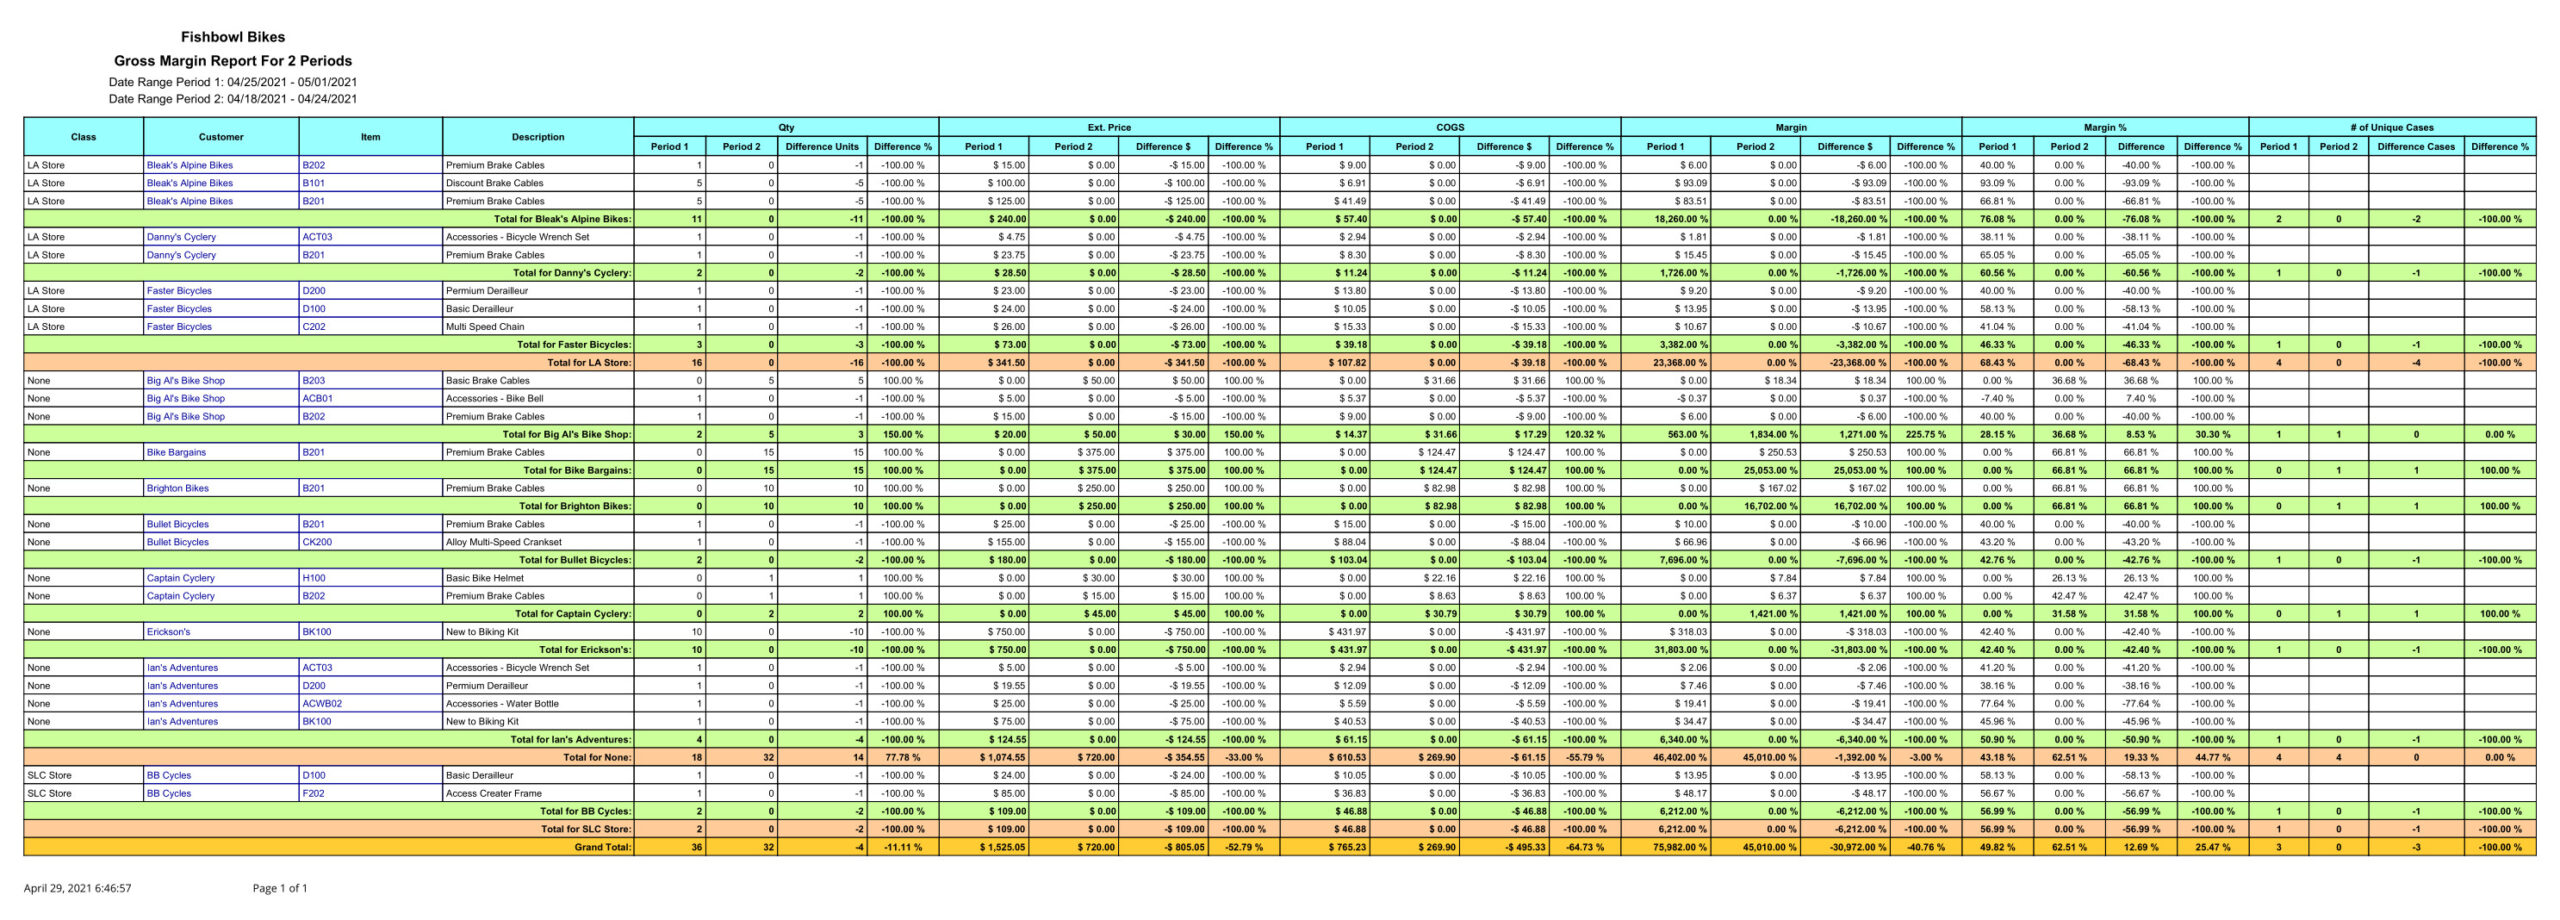
This is a Gross Margins Report that prompts the user for 2 date ranges, and compares sales per Location Group, Customer, and Items. It looks at Qty, Ext Price, Cogs, Margins, Margin Percentage, and Number of Unique Cases, allowing for performance analysis of Products per Customer with subtotal by Customer.
Gross Margin Report with Vendor
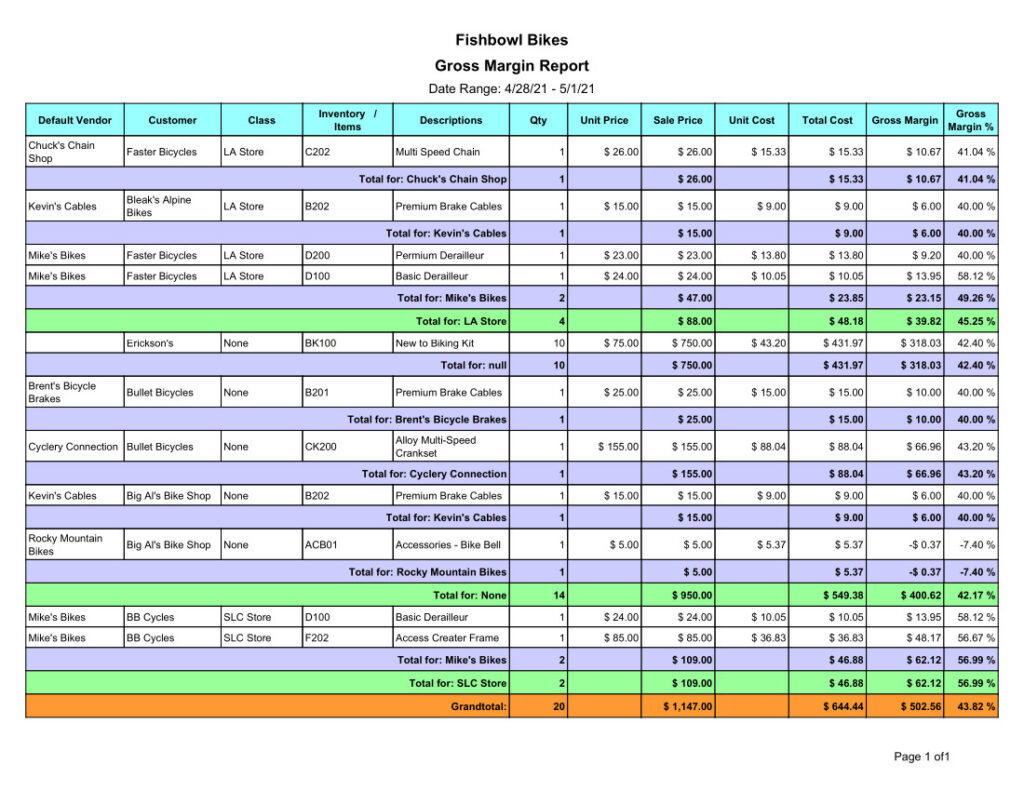
This is a report that summarizes Sales per Vendor, Customer, Class, and Products. It also allows for analysis of the performance of the Vendor by calculating the Gross Margin Percentage both per Product and per Vendor.
Merchandise Analysis by Part Report
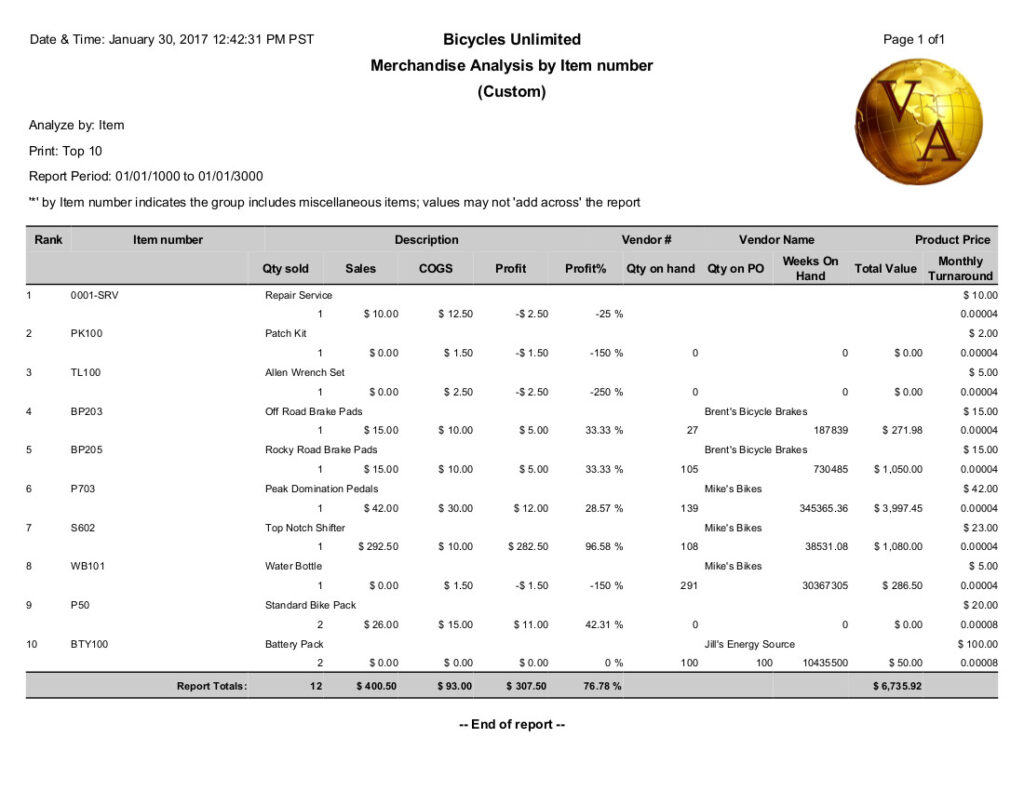
This is a Fishbowl Product Performance Ranking report that ranks Products (Items) by their Total Sales within a date range. In this report, you can see the top performing items, together with their Sales, COGS, Profit, Profit Numbers, Qty On Hand, Qty On PO, Total Item Value, and the Monthly Turnaround of the Item.
Product Sales by Customer
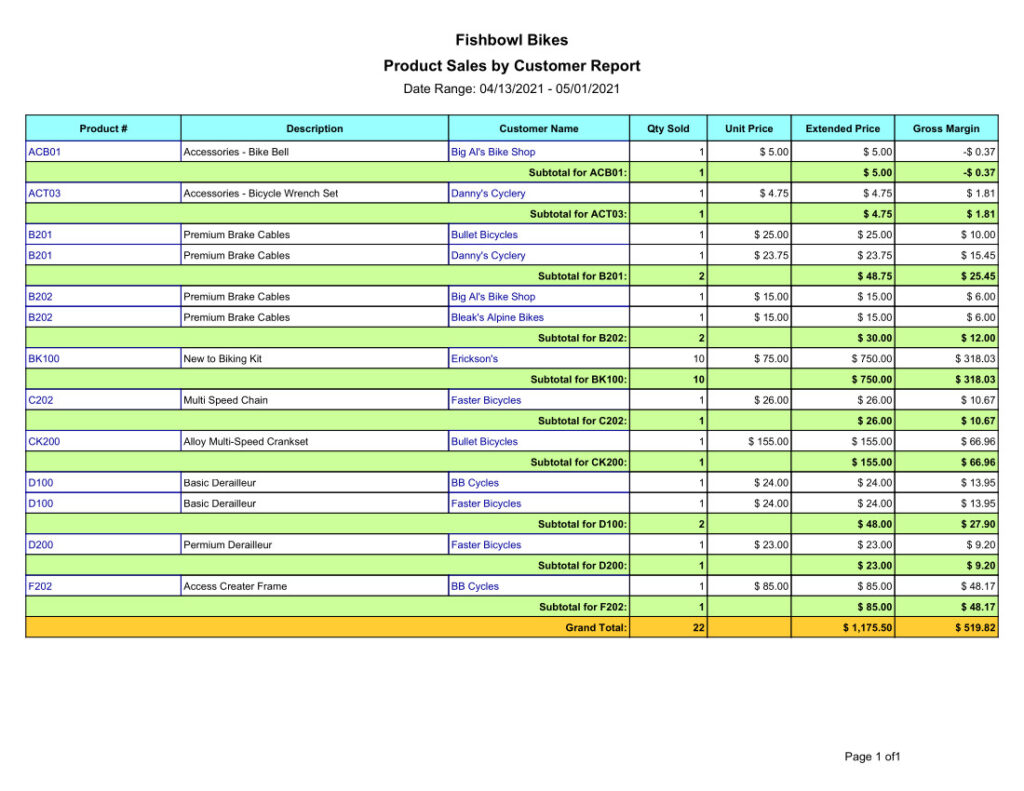
This Fishbowl Report summarizes sales by Product and Customer, with Subtotals by Product. It allows for the analysis of the performance of a customer’s activity within a certain product.
Sales by Vendor
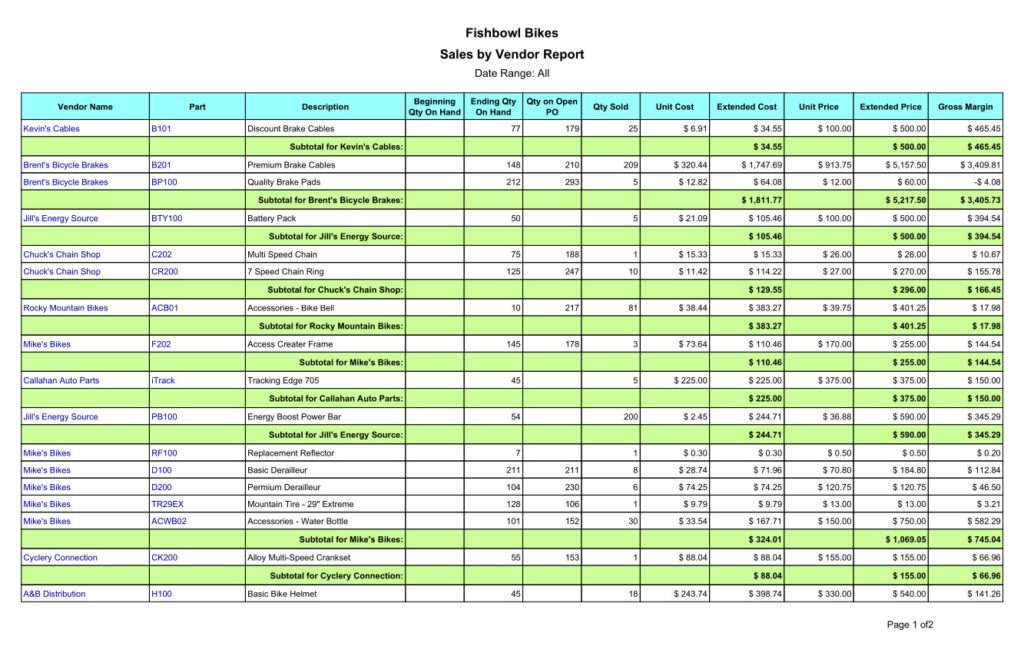
This Fishbowl Vendor Performance report allows to see Gross Margins by Vendor along with the Default Vendor parts. The report displays Vendors and their Parts, the Beginning Qty On Hand, Ending Qty On Hand, Qty On Po, Qty Sold, Unit Cost, Extended Cost, Unit price, Extended Price, and Gross Margin.
Ultimate Sales Export Report
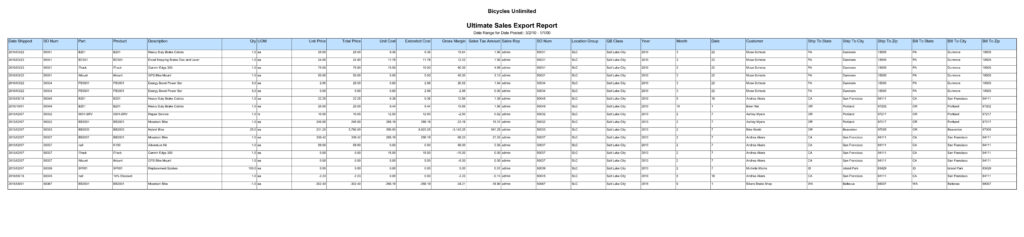
This extensive report allows for exporting Sales Information at a granular level from Fishbowl.
Interested in our services?
Connect with us to discuss your needs.